Monitors
Komodor Monitors are built to detect different scenarios, investigate certain aspects around them and provide additional context to simplify the troubleshooting process and reduce the MTTR.
Supported configurations per Monitor:
Komodor monitors are being configured on a cluster level, each monitor supports the following configurations:
- Trigger conditions - specify when this monitor should be triggered, conditions vary per monitor.
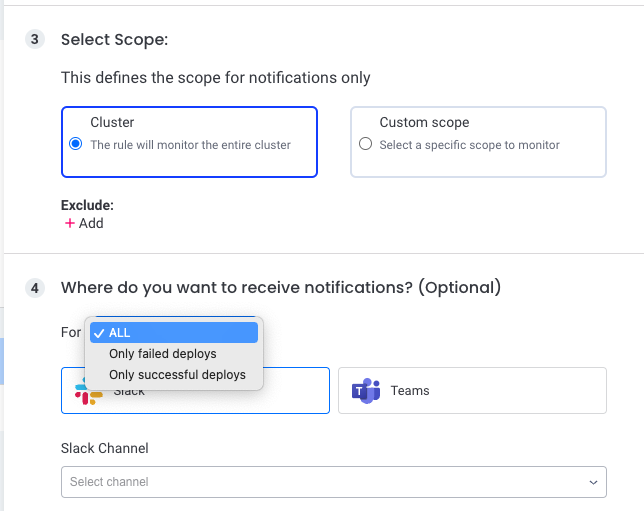
- Scope - which resources should be monitored, the scope can be configured for the entire cluster, specific namespaces, annotations or labels, the relationship between the selected resources is currently OR relationship.
- Sink/Notification - where do you want to receive notifications (Slack/Teams/OpsGenie/PagerDuty).
Prerequisites:
Required agent version - 1.0.78 (recommended - latest version)
Availability Monitor
Monitor your workload’s health (available replicas < desired replicas), creates an Availability issue on the Events and Service timelines that provides relevant information to resolve the issue. The Availability monitor will not be triggered during an active rollout.
Please note Modifying the scope of an Availability monitor might affect (remove) events from the timeline.
-
Monitor is triggered by - Service (Deployment/DaemonSet/Rollout/StatefulSet) number of available replicas < desired replicas by the specified conditions for the defined duration
-
The following checks are performed -
- Pods health Foreach Pod we'll provide the following: - Phase, Reason, Pod events - Containers list with their state, reason, logs and metrics (CPU/Memory)
- Correlated latest deployments
- Correlated node issues & node terminations For Out of memory and evicted issues, additional checks are performed -
- Check if container limit has reached
- Check if memory limit decreased prior the issue
- Noisy neighbors report
Please note Data provided in the Availability issue checks is a snapshot in time for when the issue occurred.
Please note It is possible to costume your monitors conditions and alerts for specific error categories. You can do it easily by going to "Monitors" screen, choose the relevant cluster, click "Add rule" under "Availability monitor", there you can choose the desired categories on "Trigger conditions" section.
Each category is including the following reasons :
| Category | Reasons |
|---|---|
| NonZeroExitCode | NonZeroExitCode |
| Unhealthy | Unhealthy |
| OOMKilled | OOMKilled, NonZeroExitCode - Exit code: 137 |
| Creating/Initializing | ContainerCreating, PodInitializing, PodNotReady, ContainersNotReady |
| BackOff | BackOff, CrashLoopBackOff, ImagePullBackOff |
| Infrastructure | NodeNotReady, NetworkNotReady, Evicted,NodeShutdown, Terminated, Preempted |
| Pending | FailedScheduling, NotTriggerScaleUp, PodPending, NodeAffinity |
| Image | ErrImagePull, InvalidImageName |
| Volume/Secret/ConfigMap | FailedMount, FailedAttachVolume, CreateContainerConfigError |
| Container Creation | CreateContainerError, RunContainerError, ContainerCannotRun, ContainerStatusUnknown, ReadinessGatesNotReady |
| Pod Termination | FailedPreStopHook, FailedKillPod |
| Completed | Completed |
| Other | Any reason that was not mapped in other categories |
Deploy Monitor
A Deploy monitor will be trigerred whenever a resource is being deployed/rolled-out.
Using the Deploy Monitor configuration you can define on what resources (scope) and in what occasion (failed deploy/successful deploy/both) when you would like to get a notification in one of your notification channel (Slack/Teams)
Node Monitor
Monitors Nodes with faulty Conditions.
- Monitor is triggered by - Node Conditions change to a faulty Condition, the faulty condition/s last through the configured Duration
- We perform the following checks as part of our investigation
- Is the node ready?
- Is the node overcommitted?
- Is the node under pressure?
- Are system Pods healthy?
- Is the network available?
- Are Pods being evicted? -Are user pods healthy?
- Is the node scheduable?
- Node overall resource consumption including top 5 pod consumers (requires metric-server installed)
- Notes
- The Node detector currently does not deal with nodes in an Unknown state (this means Spot interruptions or scale-down events will not be handled by the WF, could affect other scenarios as well)
- Will only run on Nodes that are created for more than 3 minutes (there is a 3-minute delay from Node create time prior to running the WF)
PVC Monitor
Monitors PVCs in a pending state.
- Triggered by - PVC in a pending state for the defined duration
- We perform the following checks as part of our investigation
- PVC creation, utilization, and readiness issues
- Volume provisioner related issues
- PVC spec change
- Identify the impact on your services
Job Monitor
The Job Monitor will be triggered when a job fails execution.
It allows you to get notified for Job failures on the defined scope.
CronJob Monitor
The CronJob Monitor will be triggered when a job (managed by CronJob) fails execution.
It allows you to get notified for the first (first failure ater a success) or any CronJob failures on the defined scope.