Metrics
Komodor shows your resource CPU and memory usage as well as their limits and requests as part of the Availability Issues in order to help you troubleshoot faster.
Prerequisites
Agent version 0.1.191 and above.
Agent values¶¶
The Komodor agent consists of a Deployment and a DaemonSet, the DaemonSet is responsible for collecting the metrics of Pods running on nodes it runs on.
To add it, enable the following values on the helm chart:
--set metrics.enabled=true - install Komodor DaemonSet, which allows it to send metrics to the Komodor SaaS.
Upgrade command¶¶
helm upgrade --install k8s-watcher komodorio/k8s-watcher --set watcher.actions.basic=true --set watcher.actions.advanced=true --set watcher.actions.podExec=true --set metrics.enabled=true
Access to Metrics in Availability Issues
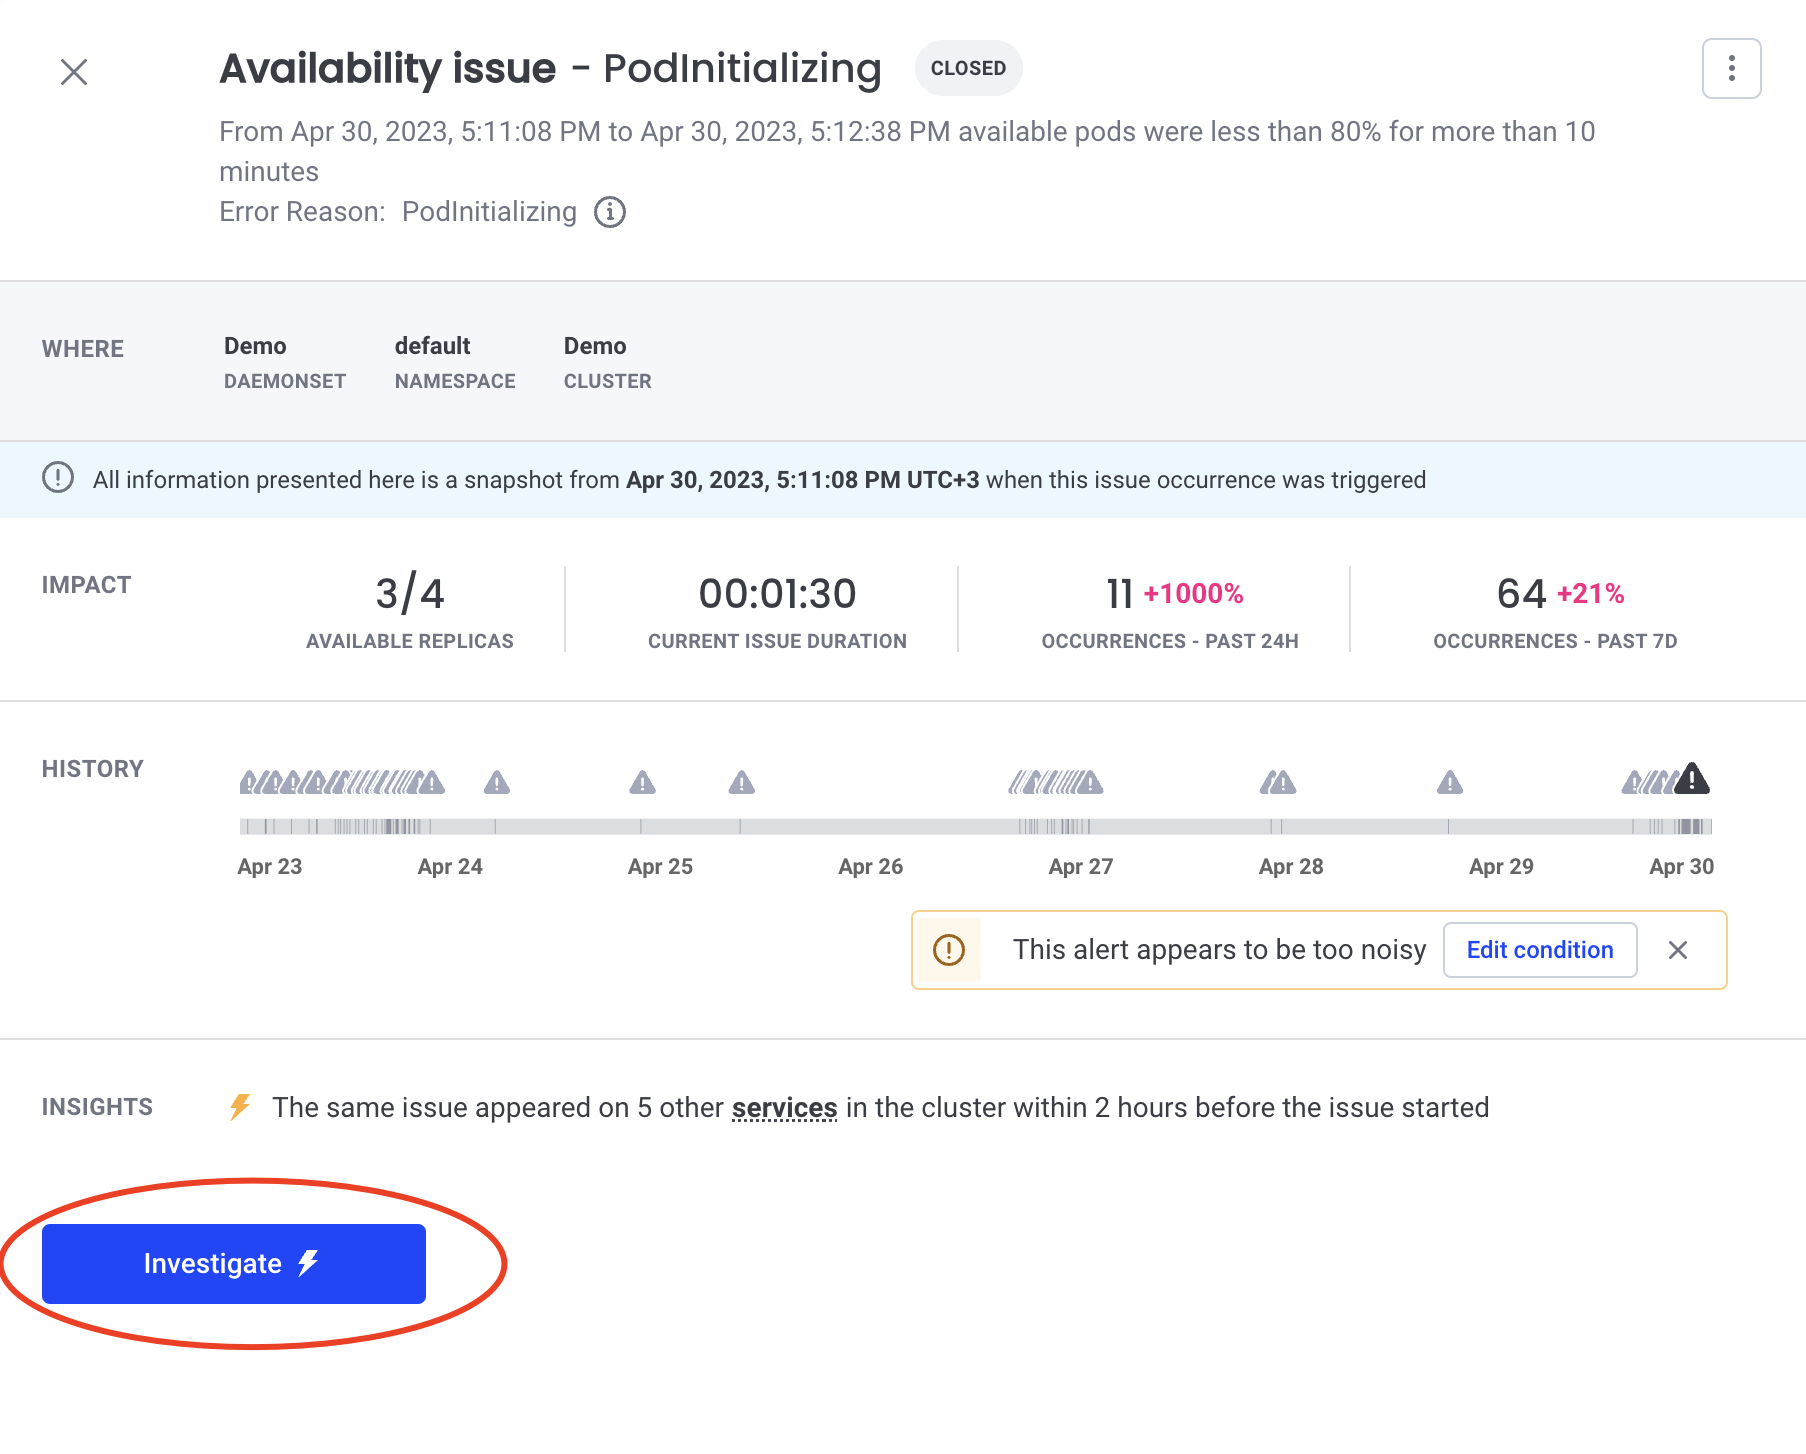
- Open the Komodor UI in your web browser and navigate to any availability issue.
- Click on “Investigate”
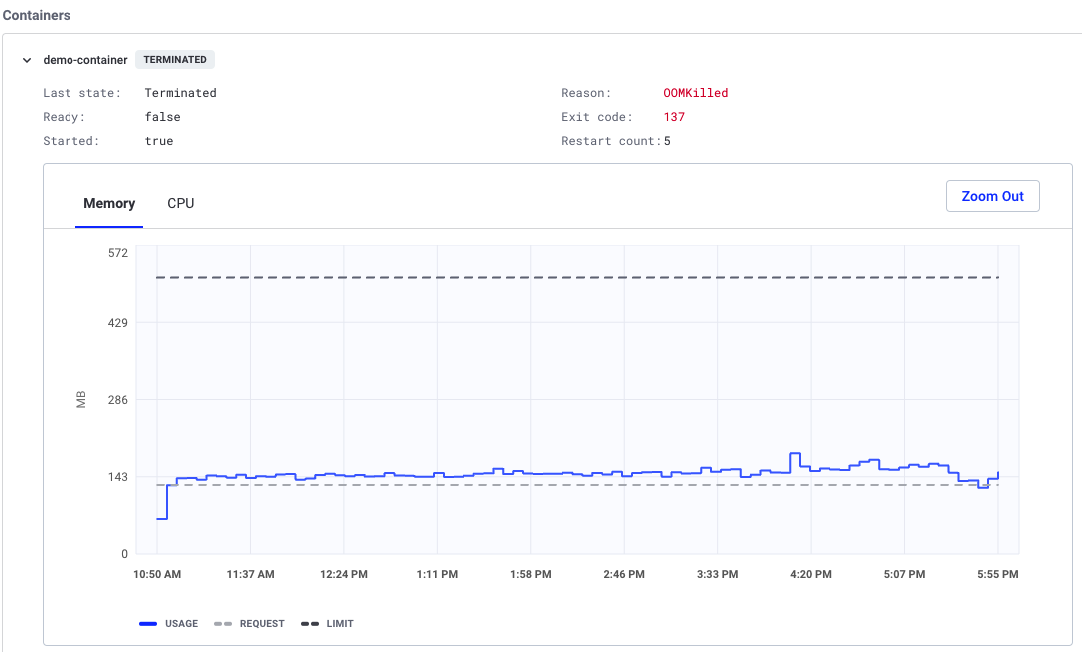
- The metrics will appear in the containers section - for each container you’ll see the metrics graph for CPU and memory, with the ability to switch between time periods of 24 hours / 7 days.
- The metrics will be seen only for issues that started after the agent installation.
Graph values
Komodor DaemonSet is collecting the metrics every 15 sec. For each data point on the graph, you’ll see the average of the collected snapshots.
How to disable
To disable the metrics collection, use the following command:
helm upgrade --install k8s-watcher komodorio/k8s-watcher --set watcher.actions.basic=true --set watcher.actions.advanced=true --set watcher.actions.podExec=true --set metrics.enabled=false