Prometheus/Grafana Alert Manager Integration
The Integration of Grafana / Prometheus AlertManager allows alerts triggered by AlertManager to appear on Komodor's timelines.
Installation
The Alert Manager integration involves 3 steps:
- Enabling the integration in Komodor.
- Creating webhook on the alert manager / Grafana.
- Adding labels to the alert.
1. Enabling the integration in Komodor
To enable the Komodor Prometheus Alert Manager integration go to Komodor integrations page, select Prometheus/Grafana Alert Manager, and install the integration.
2. (Option A) The following steps are for manual configuration on alert manager
Creating webhook
- Open your
alertmanager.ymlconfiguration file - Add a receiver to your receivers list, name the receiver
komodorand attach a sink towebhook_configs. In theurlfield, put the URL that was provided to you during the integration setup. Also set the fieldsend_resolvedtotrue.
receivers:
  - name: komodor
    webhook_configs:
      - url: "<URL_FROM_KOMODOR>"
        send_resolved: true
- Next, in
alertmanager.yml, configure a route so that your alert is routed to komodor
route:
  receiver: komodor
If you already have configured routes you can config multiple as follows:
routes:
  - match:
      severity: critical
    receiver: pagerduty
  - match:
    receiver: komodor
A note about the continue configuration of AlertManager routing rules. If it is set to false, AlertManager sends the alert to the first matching route and stops. continue default value is false.
A full YAML configuration example:
global:
  group_interval: 5m
  repeat_interval: 12h
routes:
  - match:
    receiver: komodor
receivers:
  - name: komodor
    webhook_configs:
      - url: "<URL_FROM_KOMODOR>"
        send_resolved: true
2. (Option B) Configure alerts from Grafana
- Go to
Alerting->Contact points.
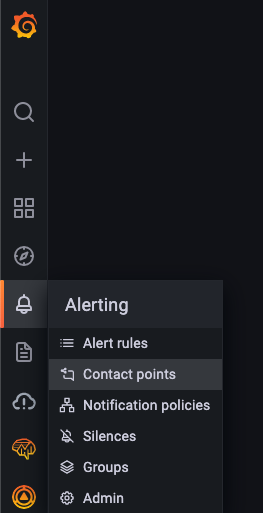
- Click
New contact point.
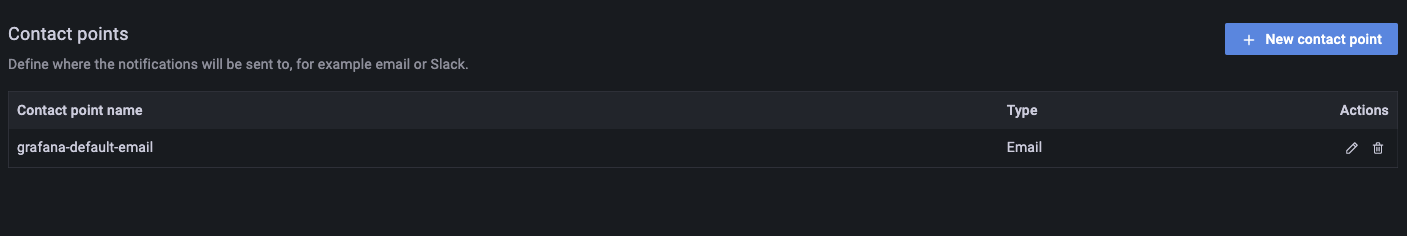
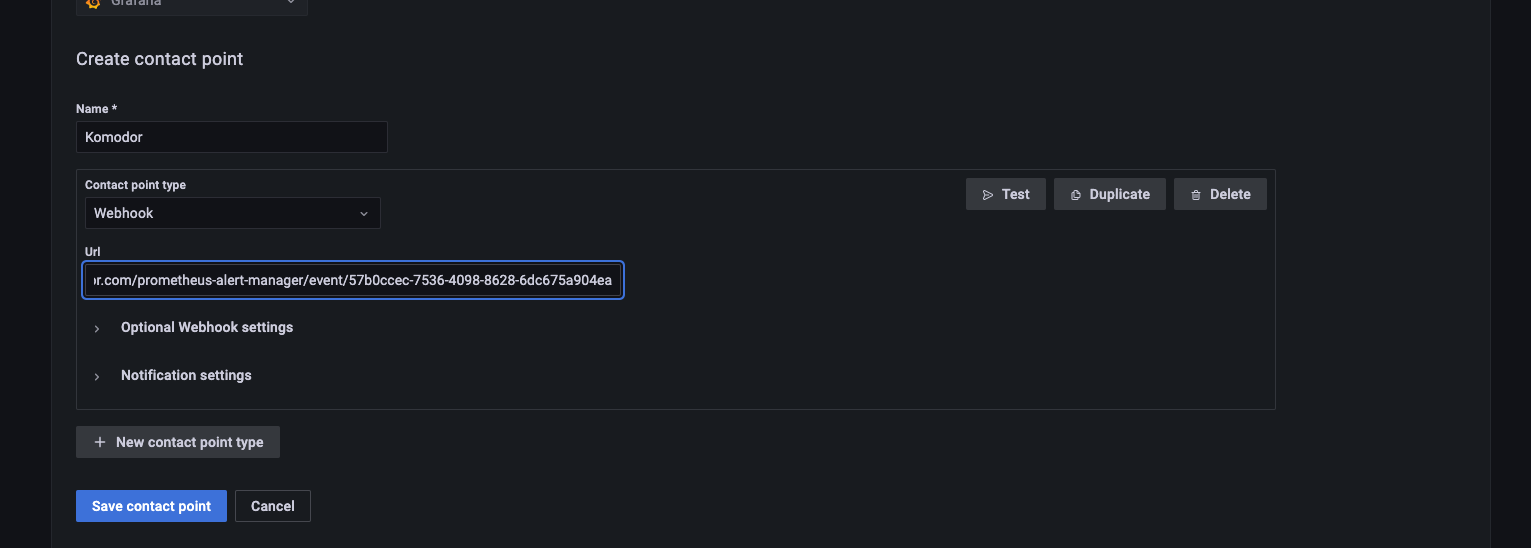
- Enter in name
komodor, inContact point typeselectWebhookand inUrlinsert the URL from the UI.
- Click
Alerting->Notification policies.
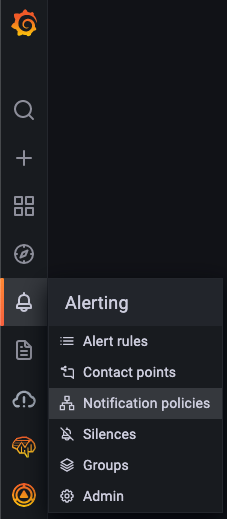
- In the notification policies, configure komodor contact endpoint as you wish to configure alerts to Komodor.
3. Adding labels to the alert.
To relate the alert to the relevant workload and make the alerts visible on workloads timelines - adding labels to alerts is required. Each alert without a label will be added to the system without mapping to a specific service.
- Please note to specify 2 labels on the alert in order to connect them to the Kubernetes workload:
service: <workload-name>
cluster: <cluster-name>
- [Optional] defining custom description to the alert on Komodor (specify it in the annotation):
description: <content>